
Unsupervised detection of security threats in cyberphysical system and IoT devices based on power fingerprints and RBM autoencoders

Abstract
Aim: A major problem in the Internet of Things (IoT) and Cyber-Physical System (CPS) devices is the detection of security threats in an efficient manner. Several recent incidents confirm that despite of the existing security solutions, security threats (e.g., malware and availability attacks) can still find their ways to such devices causing severe damages.
Methods: In this paper, we propose a methodology that leverages the power consumption of wireless devices and Restricted Boltzmann Machine (RBM) Autoencoders (AE) to build a model that makes them more robust to the presence of security threats. The method consists of two stages: (i) Feature Extraction where stacked RBM AE and Principal Component Analysis (PCA) are used to extract features vector based on AE’s reconstruction errors. (ii) Classifier where One-Class Support Vector Machine (OC-SVM) is trained to perform the detection task.
Results: The validation of the methodology is performed on real measurement datasets and covers a wide range of security threats (namely, malware, DDOS, and cryptojacking). The obtained results show good potential throughout the five datasets and prove that AEs’ reconstruction error can be used as a good discriminating feature. The obtained detection accuracy surpasses previously reported techniques, where it reaches up to ∼ 98% in most of scenarios.
Conclusion: The performance of the proposed methodology shows a good generalization for detecting different security threats, and, hence, confirms the usefulness and applicability of the proposed approach.
Keywords
Introduction
The world is witnessing an enormous technological transformation, thanks to the offered services and applications via billions of connected devices. Whether it is the Internet of Things (IoT) or Cyber-Physical Systems (CPS) devices, the provided services (e.g., self-driving cars, smart healthcare, industrial IoT, or any CPS, to name a few) will have an incredible impact on people’s lives. Given the exponential growth of such devices (by 2020, ∼50 billion devices are expected to be in operation[1]), and the continuous access to the Internet, unfortunately, these devices represent the next frontier for hackers. Despite the global eagerness about the hefty benefits that IoT and CPS bring, this narrative is two-sided: On the one side, IoT and CPS create immense market potential; according to McKinsey, by 2025, the expected annual revenue will reach $ 4-11 billion[2]. On the other side, they create huge security vulnerabilities (25% of the identified attacks in enterprises are expected to be originated by IoT devices in 2020[3]. Hence, the need for an efficient methodology to detect security threats is paramount.
To highlight the severity of the problem to be addressed, the following are recent motivational incidents: (i) The number of compromised Android devices by banking malware has increased by a factor of 3 in 2018, according to Kaspersky’s reports[4,5]. The total number of impacted users by at least one such attack during the last year reached 1.8 million; and (ii) In October 2016, there was a massive Distributed Denial of Service (DDOS) attack that caused widespread disruption of legitimate Internet activity in the US. This denial of service attack from unknown culprits on a US Internet service provider’s domain name system caused user access to be severely restricted. The source of the attack was about 100,000 malicious IoT devices, according to the authors[6]. These incidents prove that existing detection techniques very often fail to prevent such threats, and hence the need for second line of defense is preeminent.
Earlier research efforts are implemented at different levels: network level[7,8] and devices level[9–14]. Network level approaches (e.g.,[7,8,15]) aim at identifying potential abnormal or malicious user behaviors by exploiting the idea of resource management (bandwidth and power) and prospect theory. In critical applications such as Unmanned Aerial Vehicles (UAVs), such solutions add another layer of protection, making these applications more resistent to different types of attacks. In a parallel research direction, and according to Cvitic et al.[16], the device layer (also called the physical layer) creates the highest risk due to the limitations of devices. For that reason, the scope of our paper is the device level anomalous behavior detection.
In this context, we formulate the problem of detecting security threats in devices as an anomalous behavior detection problem, where the anomaly that is causing the device to behave anomalously could be due to malware, ransomware, or DDOS attack, to name a few. As shown in Figure 1, the general process starts with data acquisition (also called monitoring), followed by data analysis and decision making. An anomaly, as per the IEEE standard, is defined as any condition that deviates from expectations[17]. Anomaly detection refers to the process of using models to identify behavior that is different from the normal behavior of a systemm[18].
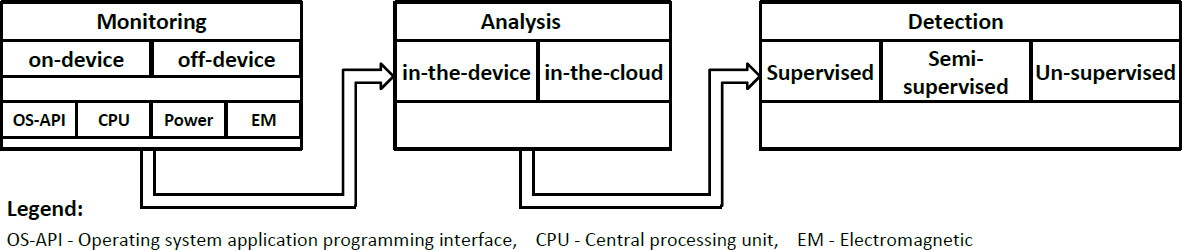
Figure 1. Steps for anomaly detection techniques
As shown in Figure 1, device level anomalous behavior detection studies can be grouped based on the following: (i) the monitoring methodology (i.e., off-device, using external tools[9–11] and on-device: using internal logging software[19,20]); (ii) the data being monitored/analyzed (e.g., source code and OS of the device[21], the power consumption of the device[9,19,22], CPU and memory utilization[23], the network traffic of the device[24], or even the electromagnetic radiation of the CPU[10,11]); (iii) the analysis location (i.e., in-the-device, analysis performed in the device itself, and in-the-cloud, analysis carried out on a remote server); and (iv) the employed detection technique (i.e., supervised, semi-supervised, or unsupervised techniques). It can be noted that the literature is quite rich; however, each of these approaches has its pros and cons. For example, on-device-based solutions can cause computation and resource overhead to the system[25]. They further raise a data integrity flag, whereas, if a device is compromised, then so could be the monitoring means and the collected information themselves[25,26]. API and OS based techniques that use static analysis have some limitations, namely accessing the source code. Even if such an access were granted, if malware developers learned about the hypotheses in analysis, they could adapt their code to look benign and hence go undetected.
Our paper proposes an off-device monitoring and analysis approach that aims to detect security threats in IoT and CPS devices. In applications that require a total decoupling (isolation) between the monitoring tool and the target device (the monitored device), off-device-based approaches are preferable. The reason is that they preserve the integrity of the monitoring tool/data even when the monitored device itself is completely compromised or under an attack. Therefore, the proposed methodology is based on monitoring the power consumption of a device and treating it as a signal carrying information about the health of the device. Unlike other studies that use the power consumption of devices to detect malware[9,19,20,27–29], our proposed approach requires only the normal behavior of a device in the training phase. In other words, the current approach is a semi-supervised detection technique; however, those in[9,19,20,27–29] are all supervised techniques that require the label of both classes, healthy and malicious. Therefore, this methodology aims at detecting new/unseen anomalous behaviors (e.g., DDOS and zero-day attacks).
The proposed detection methodology is based on: (i) applying a sliding window to the signals to increase the number of observations of our dataset; (ii) utilizing stacked RBM Autoencoders (AE) to process the collected information and unsupervisedly extract/learn features based on the reconstruction errors of AE; (iii) applying PCA to the reconstruction errors of AE, thereby isolating noise and outliers from the training of the reconstruction; and (iv) training an OC-SVM on the extracted/selected features to detect possible security threats. The solution strategy makes use of two hypotheses: (i) Every piece of software, whether malware or legitimate, would have a fingerprint in the power consumption of the wireless device that makes it inevitable for malware to go undetected; (ii) The power consumption signals obtained from the wireless device that is “malware free” should have similar patterns (normal/expected behaviors). Such behaviors can be characterized by training Autoencoders (AE). On the other hand, if the device starts to behave anomalously due to certain causes (security threats in our case), its power consumption signals should reflect that as a form of deviation from the norm. Consequently, the resultant AE output—reconstruction error—should be minimal if the wireless device is still behaving normally and maximal once the device starts to behave anomalously (maliciously).
To evaluate the effectiveness of the proposed solution, we applied our methodology to a large class of datasets that covers the three main aspects of the device’s security: confidentiality, integrity, and availability. Such validation coverage was not addressed in previous studies[9,27,28]. We developed an emulated malware that can be tuned to represent different malware behaviors. By considering a tunable emulated malware, the idea is to cover a wide range of malware behaviors so that our methodology can perform well against real malware as well. Moreover, we tested this argument using five real malware (taken from the well-known Drebin dataset[30]) and found that our approach generalizes well on them too. We even evaluated our system on a malware that performs cryptomining, which is a malware that takes over a device’s resources and uses them for cryptocurrency mining without the user’s explicit permission[31].We also implemented security attacks that are widely encountered in IoT and CPS devices, namely Distributed Denial of Service (DDoS), where we used the device as a victim of DDOS and as an attacker (a source of a DDOS attack). We used a smartphone and a generic IoT device to conduct the experiments and validate the framework; however, the idea can be ported to a number of application scenarios with additional external hardware to measure the power signal: drones and mobile robots, to give some examples. In addition, it can be extended/applied to other computing devices: medical devices or CPS devices. In all of the evaluation scenarios, we achieved a high detection accuracy, where, in some cases, the accuracy of our work outperformed previously reported detection approaches with 9%-20% detection performance gain.
The main contributions of this paper are as follows:
To the best of our knowledge, this is the first work to leverage a combination of stacked RBM Autoencoders, data augmentation, and principal component analysis (PCA) to capture discriminative information (features), in an unsupervised fashion, from the power consumption signals of wireless devices for security threats detection;
We utilize the extracted features to build a classifier based on the One-Class SVM that detects when a device is compromised;
We empirically validated the methodology on a wide range of security threats to demonstrate its effectiveness using real measurement datasets
Related works
In this section, we discuss the research efforts about detecting a device’s anomalous behavior due to security threats. We limit our review in this paper to studies that mainly consider the side-channel information and adopt dynamic analysis to detect malware. More specifically, we review only the studies that investigated various techniques to detect malware in embedded and wireless devices based on analyzing their power consumption information.
Detection of anomalies using devices’ power consumption information was firstly introduced by Kim et al.[29]. They highlighted the fact that the power consumed by devices can be used to detect anomalies which were difficult to detect by only analyzing the static characteristics of an application. The prototype that they built is for Windows phones and was used to detect a number of malwares with detection accuracy reaching 80%. Similar to Kim’s work, Jacoby and Davis[22] showed how to analyze the power consumption and CPU utilization to reveal network attacks by using a battery-based Intrusion Detection System (IDS). In the work[12], Hoffmann et al. showed that the additional consumed power due to malware is not significant and is similar to the noise introduced by unpredictable user and environment interactions. Their conclusion stated that battery life information was not very discriminative to be used to detect malware on smartphones. While their claims might be correct given the fact that their conclusion is based on the on-device PowerTutor application[32], our measurement approach is very different, and our measurement’s sampling frequency is much higher, which, in turn, facilitate higher chances of detecting events that PowerTutor fails to detect. While the PowerTutor supports 4 samples per second, the Monsoon power monitor used by us supports 5000 samples per second of power measurement. As a common note about most of the reported techniques, the time required for the analysis is significantly long, which makes them impractical
In 2014, Zefferer et al.[19] proposed a different methodology, in which they extracted the power consumption of an emulated malware running on a smartphone also using the PowerTutor app. Mel Frequency Cepstral Coefficients (MFCC) was utilized to extract features from each power trace, and then they fit GMM (Gaussian Mixture Model) to classify the power traces. This methodology performs well for recognizing emulated malware with an accuracy of 92%, but one drawback is that the power consumption was taken with a low sampling rate. Consequently, such a technique may fail to detect malware that is rarely active. This disadvantage is tackled in the present paper by using an external tool with a much higher measurement sampling rate (5000 samples/s) and changing the way the features are extracted and the way the classification is performed. Following a very similar approach, Yang et al.[20] monitored the power consumption of Samsung Galaxy S5 and LG G2 smartphones using an on-device tool (PowerTutor[32]). They collected the CPU power consumption signals and used them to extract a feature vector; the extracted features are MFCC coefficients. They then performed a waveform feature matching using a GMM model. They claimed that the learned model can detect malware with 79% accuracy; moreover, the model can classify the category of an app (game, browser, or music) with an accuracy of more than 65%. This disadvantage has been tackled in our work by using an external tool that has a much higher measurement sampling rate and changing the way the features are extracted and the way the classification is performed.
Azmoodeh et al.[14] presented a machine learning based approach to detect ransom attacks using the power consumption of Android services. Similar to most smartphone malware detection papers, they used PowerTutor to collect the power traces. They used k-Nearest Neighbors, Neural Networks, SVM, and RF as detection techniques. Bridges et al.[13] analyzed CPU power consumption of a general-purpose computer to detect malicious software. They monitored an uninfected device performing a fixed task for a certain period of time to learn its normal behavior. Then, the collected signals are processed to extract three features: statistical moments, L2-Norm Error, and permutation entropy. Finally, a classifier is trained on the extracted features. The reported results show high detection performance, ∼ 100% TPR (true positive rate) when using an anomaly detection ensemble.
The usage of Electromagnetic (EM) radiation for malware detection was also investigated in several studies[10,11,25]. The main idea in these studies is to analyze EM signals emitted from embedded devices to detect anomalies. Their framework externally monitors a device in order to collect its emitted EM signals while it is performing its regular tasks. The approaches to analyze the collected signals vary among these studies. Nazari et al.[25], for instance, have extracted features by converting EM signals into a sequence of sample spectra (the power spectral density using Short-time Fourier transform (STFT)). Then by applying thresholding and comparing the statistical distribution of the extracted features, a decision is made (anomaly or not). Following the same concept, Khan et al.[10,11] explored the idea of using a multi-layer neural network to model the behavior of a device using its EM emissions. Once the device encounters any deviation in its activity, the model flags it as an anomaly. Although EM based approaches are based on off-device monitoring, they require physical proximity to the device’s CPU, along with proper alignment and setup. Such invasive approaches have questionable usability and practicality. These studies are invasive in the sense that internal access of a device component is required, where the EM receiver has to be placed close to the CPU (according to their experimental setup). Now, if the targeted device were in a package that suppresses the EM radiation or even weakens the radiated signal, then the applicability of these approaches would be problematic. Our approach, on the other hand, takes the overall power consumption of a device, which does not require any instrumentation of the internal components of a device such as CPU or network card to collect the signal.
To this end, although there are several studies about malware detection using the power consumption data of devices, to the best of our knowledge, none of the studies in this domain have attempted to leverage a combination of stacked RBM Autoencoders to extract features from the power consumption signals of wireless devices in an unsupervised manner, nor have they covered the threats that we do in this paper.
Detection system model
This section describes the system model of the proposed detection methodology as well as the threat model. Figure 2 introduces a high-level view of our proposed solution strategy’s system model. In this model, we use the term Cyber-Physical Space to refer to any cyber system or cyber application that is built on top of or based on a technology to allow autonomous/semi-autonomous operation of the physical system. The core layers of establishing a cyber space are sensing/actuating, communicating, and application. Sensing and actuating are performed through devices that we describe in our model as a reference device. Reference Device is a hardware device (e.g., embedded device) that contains a special-purpose computing element and network module (wireless and/or wired) designed for one or very few specific task(s). Such a device works as a main block in a larger system for monitoring and controlling purposes (ex., interacting with the external environment physically or logically through sensors and actuators). Examples that can be covered by the reference model can be found in a large range of applications; however, in the context of this paper, we target IoT, CPS, and MCPS (Medical-CPS) applications. The focus is on devices that have limited direct human interactions.
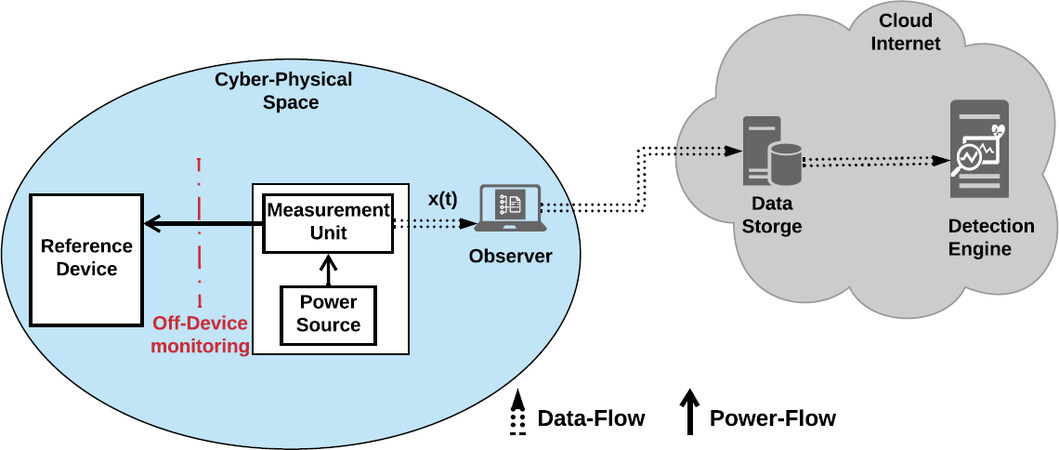
Figure 2. System model
Power Monitoring Unit is a device that can be connected to the power source of the monitored device. The assumption is that the power monitor unit causes no overhead to the actual operation of the device itself (i.e., off-device monitoring approach). Moreover, it has a reasonably high sampling rate to capture the activities with small durations. Its mode of operation is completely decoupled from the monitored device/system to ensure that the integrity of measurements is preserved. Lastly, it is connected to a reporting system, called observer that sends the collected power signals to the cloud for analysis (i.e., to the Detection Engine). In our experimental system model, our Observer is a lap-top computer used to store the collected power measurements in a database in CSV format and then upload these data to the cloud for analysis. Detection Engine is the main block of the proposed framework. The engine resides in the cloud to perform data analytics. The details of the employed detection approach are explained in detail in the following subsection. Once the engine receives a new power signal, the function of this component is to give informative insights to the device’s operator or owner as to whether the device is compromised or not. Finally, Compromised Device is a device that exhibits anomalous behavior. The possible causes that can lead a device to misbehave are a wide range of security threats that we explain using our threat model.
Security in IoT and CPS devices are addressed differently based on the application and the devices’ compute capabilities (e.g., Radio Frequency Identification based devices in supply chain management[7] and unmanned aerial vehicles[15]). However, the main focus of this paper is on devices that perform basic functions as outlined above in the reference device’s model. Although the reference device’s model seems basic and simple, such a device and the performed tasks exist in a wide range of applications. Whether it is self-driving cars, smart parking systems, Industrial IoT, or any cyber-physical system, to name a few, the explained reference model still applies. In all of these systems, we find that tasks like sensing, actuating, and controlling are there.
A device can be operating in two main operation modes (statuses), namely normal operation and abnormal operation, as shown in Figure 3. In the normal operation mode, if the device carries out its tasks without exhibiting any issues, it said to be a healthy behaving device. In contrast, the abnormal operation mode refers to a misbehaving device where the cause of such a behavior can be a security threat, which we explain using the following threats model, or a faulty device which is out of the scope of this paper due to the following fault tolerance assumption. In fail-stop model, a device with one or several faulty components stops working, hence it can be detected right away once it becomes unresponsive. The focus of this paper is detecting the security threat; therefore, we use the following threats model. We define security threats as security issues or harmful events that aim to harm the device in one of the following ways: (i) Compromise the confidentiality and the integrity of the device/user/system through (a) transferring of data to unintended remote servers (e.g., malware and spyware); (b) hijacking of the device’s resources to perform tasks for the attacker’s desire (e.g., bots: mining cryptocurrency and ransomware). (ii) Restrict the availability of the device such that the provided services become partially/fully inaccessible (e.g., DDOS and jamming).
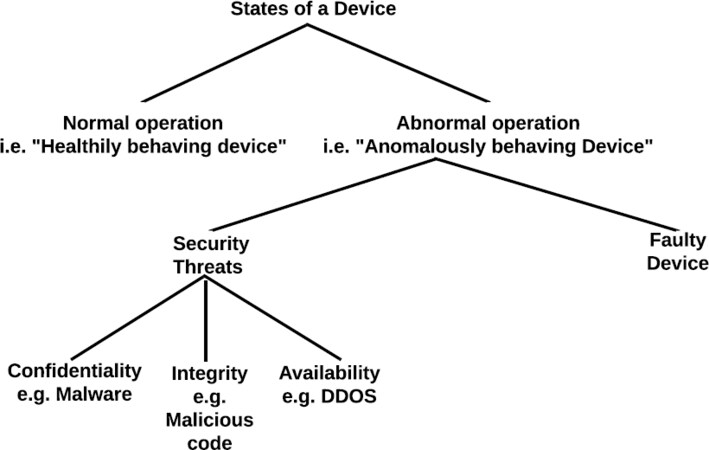
Figure 3. Break-Down of an IoT device’s status
In comparison to previous methods[7,15], the only assumption we make in our system model is that an attacker has the ability to install a threat on the targeted device regardless of the communication protocol. Moreover, the installed malicious code can gain full control over the device’s resources (software and hardware). Since in our proposed anomalous behavior detection framework, we mainly target Internet-connected devices, such an assumption holds in real systems/scenarios.
Data analytic methodology
In this section, we start by providing an overview of the tools used throughout our methodology. Then, we describe the proposed detection methodology and the idea behind it in detail.
Preliminaries
Our methodology makes use of three well-known algorithms. In the following subsections, we give the necessary background on: (i) the used technique to extract features—Restricted Boltzmann Machine (RBM); (ii) the employed dimensionality reduction technique—Principle Component Analysis (PCA); and (iii) the used classifier—One-Class Support Vector Machines (OC-SVM). Then, in Model Pipeline subsections, we give the details of how these tools and algorithms are used to make up our detection framework.
Restricted Boltzmann Machine (RBM)
RBMs are an unsupervised machine-learning that were first introduced by Hinton et al.[33]. They are originally intended for nonlinear dimensionality reduction and feature extraction. Later, and due to their capability to efficiently model the training data distribution, they are a suitable option for anomaly detection applications[34–36]. RBM is a stochastic graphical model which learns a probability distribution over input dataset and extracts their relevant statistical features. This is done while restricting its visible units and hidden units from forming a fully connected bipartite graph. Unlike other DL (Deep Learning) structures which utilize deterministic activation functions (e.g., logistic or ReLU) in their activation units, RBM uses stochastic units with particular distribution (usually binary of Gaussian). An RBM is comprised of two layers, visible and hidden layers, interconnected using symmetrically weighted connections (weights). Units (h) in the hidden layer capture higher-order correlations of the visible units (x) in the visible layer connected to it[37].
The training procedure minimizes the overall energy so that the data distribution can be well captured. The used energy function is defined by[37]:

where v is the input signal vector that forms the visible units and h is a vector that forms the hidden units (features); θ = {w, b, c} are model parameters. Starting with random weights, the state of hidden units h is set based on the joint probability defined using:

where Z(θ) is a normalizing factor called partition function. The marginal distribution over the visible layer v is:

Since single RBM structured models poorly represent the features of the dataset, we can build a more robust model that can sufficiently extract high-level abstract features by stacking several RBMs to form stacked RBM Autoencoders (also called Deep Belief Network (DBN))[38]. The stacked AE can be trained via a greedy layerwise procedure. Each layer is trained as an RBM using Contrastive Divergence (CD) strategy (e.g., Gibbs sampling[37,39]); after each RBM layer of the stacked AE has been trained, weights are clamped and a new layer is added. Finally, fine-tuning using gradient descent and backpropagation is required to glue everything together. For more details on the structure of RBM and stacked RBM AEs and the way they are trained, the reader is directed to[33,37,38,40].
Principal Component Analysis (PCA)
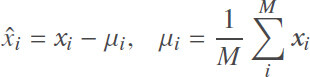
PCA is a dimensionality reduction technique that reduces the number of features in the dataset. At the same time, it tries to retain as much information as possible by preserving the maximum variance in the original dataset[41]. Therefore, by linearly transforming the original data points to another space, the inherent structure of the data makes them easier to recognize/classify. PCA is performed by using Singular Value Decomposition (SVD). Given X which is a matrix of signals of size M × n. Each row is signal/observation x that forms a vector of a size 1 × n. The first step of PCA is to mean center the matrix of signals, which is accomplished by subtracting the mean of signals from each signal xi as shown in Eq.[41]:
The resultant mean centred matrix X̂ (it is of the same size as X) is then decomposed using SVD,

Here, U is a n × M unitary matrix, V is a n × n unitary matrix, and Σ is a diagonal matrix comprising the singular values of X̂ in decreasing order[42]. A reduced dimensional representation of X̂ can be obtained by discarding columns of U and V,
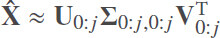
Here, j denotes the number of columns (principle components) retained.
To this end, we have explained the theory of computing PCA using SVD; however, in practice, computing SVD is computationally complex. Thus, several efficient algorithms are widely used to compute PCA efficiently. In the implementation of our methodology, we use scikit-learn Python library[43] to compute the PCA. For more details on the scikit-learn PCA implementation, the reader is directed to[44].
Classification - One Class SVM
One-Class Support Vector Machines (OC-SVM) is an anomaly detection technique. It was originally developed by scholkopf[45] to identify novelty unsupervisedly. In his formulation[45], given a training set X =  , the algorithm learns a function (soft boundary) that returns +1 in a region capturing “majority” of the training observations if xi falls within “normal region”, and −1 elsewhere. In the case where the data is not linearly separable, the so called kernel trick is applied, where each point is implicitly projected to a higher dimensional feature space (through linear/nonlinear kernel) to separate the data set from the origin. Then one needs to solve the following quadratic optimization problem[45]:

subject to

The parameter υ ∈ (0, 1] sets an upper bound on the fraction of outliers and a lower bound on the number of training examples used as support vectors.
Model Pipeline
The intuition behind our methodology is that power consumption signals obtained from a device that is free of security threats should have similar patterns (normal/expected behaviors). Such behaviors can be characterized by training Stacked RBM Autoencoders (AE). However, if the device starts to behave anomalously due to certain causes (presence of security threats in our case), its power consumption signals should reflect that as a form of deviation from the norm. Consequently, the resultant AE’s output-reconstruction error-should be minimal if the wireless device is still behaving normally and maximal once the device starts to behave anomalously. The framework illustrated in Figure 4 is designed based on the above stated intuition.
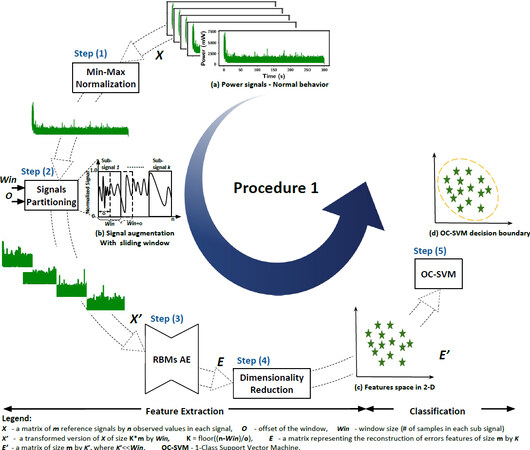
Figure 4. Overview of the methodology: Signals Transformation and Model Training
The basic concept of our methodology can be explained using two main procedures. Procedure 1, shown in Figure 4, is comprised of two main stages, namely the Feature Extraction stage and Classification stage. Procedure 1 is used to train and test the model on a dataset collected from uncompromised device(s). Procedure 2, shown in Figure 5, which makes use of the learned models from Procedure 1, describes the process of labeling a new unlabeled measurement obtained from a device as to whether it came from a compromised device or not.
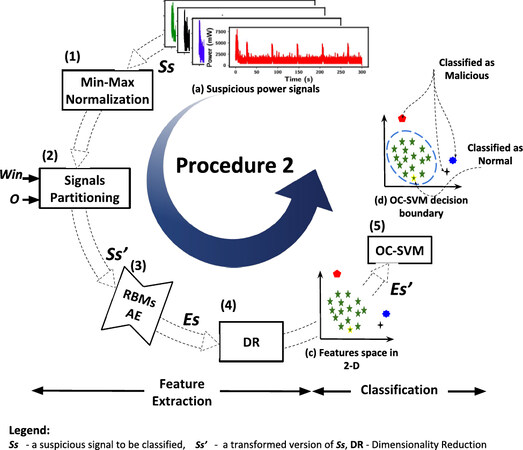
Figure 5. Detection of Anomalous Behavior
The structure of our Feature Extraction stage starts with data augmentation to increase the number of observations used in the training phase. Following the data augmentation, we use a pretrained RBM AE to extract the features. The structure of the pretrained RBM AE is kept simple with two RBMs only. Such a simple/shallow structure is chosen to reduce the complexity of the methodology. Going for a deeper structure increases the computational complexity. Therefore, to make the methodology suitable and efficient for online and real-time detection, we chose to keep the model size minimal as long as it provided us with a good detection performance across the validation scenarios. Finally, we apply PCA to reduce the dimensions of the extracted features space so that the classifier avoids the over-fitting problem, and the resultant detection performance is optimized.
Although combining RBM AE and PCA structure seems redundant, as both RBM and PCA are commonly used for dimensionality reduction, the way we use the pretrained RBM AE does not overlap with the functionality of PCA. We use the pretrained RBM AE to extract features in a novel way, as shown in the following sections. In our particular case, PCA complements the feature extraction process in a flexible and lightweight manner. The flexibility is in terms of exploring the number of features (number of principal components) that can be used in the classification phase. However, if we used stacked RBMs to do the whole process (i.e., extracting the features and lowering the dimensionality in one shot, and then exploring how many features are needed to achieve a satisfactory detection performance), it would require a deep stacked RBM structure, which would be computationally costly. Moreover, in practice, having a deep stacked RBM is not suitable for real-time applications, such as quickly detecting security threats.
Procedure 1: Features Extraction and Model Generation
The input data to Procedure 1 is X, which represents the raw dataset used for training and testing. The formal definition of X is as follows: 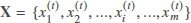 , which is a matrix of size
  represents one reference signal [shown in Figure 4 (a)] and is taken by keeping the same time duration and conditions in terms of configuration of a wireless device. Each of the rows which forms the matrix X is represented by
  , which is described as follows:
 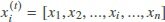 . Hence, is a vector of size 1 × n. In other words, the elements in represent the values of the power consumed by a device sampled at frequency Fs for a time t = T.
Stage 1: Feature Extraction (FE)
Min-Max Normalization: Step (1) depicted in Figure 4, is the first step in this stage where Min-Max Normalization is performed to every signal in the dataset. Since power consumption signals from different devices have different scales, we normalize [using the formula described in Equation (6)] all signals to be in the range [0,1]. This is also necessary for a faster convergence when training the AE.

Signals Partitioning with Sliding Window: Then, in Step (2), for each normalized power signal, we apply a sliding window to partition the signals into sub-signals, as shown in [Figure 4 (b)]. Based on a window size Win and an offset O, we partition each signal accordingly. The output of this process is a transformed version of our input dataset X′. X′ is also a matrix of size m ∗ K × Win, where  . The sliding window idea is introduced at this point in the model pipeline to address the cases where the datasets are limited. The main reason behind this step is to deploy a robust model and avoid the over-fitting problem regardless of the dataset size.
Next, we use the subsignals in X′ to train the RBM AE and compute the reconstruction error.
Pre-trained Stacked RBM Autoencoders: This is the main block in our FE stage [Step (3) in Figure 4]. As shown by Hinton et al.[33] in an RBM Autoencoder can be built using a pretrained RBMs. Such an approach, RBM based Autoencoders, showed a good performance in different domains such as speech recognition[46], obstacle detection[47], text categorization[48], and fault diagnosis[49]. The structure of our stacked RBMs AE includes 2 pretrained RBMs, each of a size (number of hidden units, h) 3000 and 500, respectively. We use power consumption signals obtained from a “malware free” device to perform greedy layer-wise unsupervised training to the two RBM layers. After data pre-processing, we use X′ as an input to train the stacked RBM AE. Specifically, we train each of our RBMs [RBM1 and RBM2 Figure 6 (a)]individually, as suggested in[33,38]. Then, we create a stacked RBMs AE, as shown in Figure 6 (b), by stacking the two RBMs and unrolling them to create the RBM based AE. As shown in Figure 6, the input of the AE is the pretrained RBM1 visible layer, and the learned feature’s activation of the RBM1 (h1) is sent to the visible layer of the next layer, RBM2. This is what makes the encoder part. The decoder is formed by adding an equal number of the opposite layers using transposes of the base encoder’s weights. Finally, the entire system can be treated as a feedforward traditional AE at this point. We fine-tune the RBM AE using the backpropagation algorithm described in algorithm 1. The objective is to minimize the mean squared error (i.e., obtain an optimal reconstruction of the normal behavior of the device) and iteratively update the parameters of the stacked AE. After initializing the network parameters with the pertained RBMs’ weights, we compute the mean squared error and then update the parameters accordingly until they qualitatively converge using the stochastic gradient descent method.
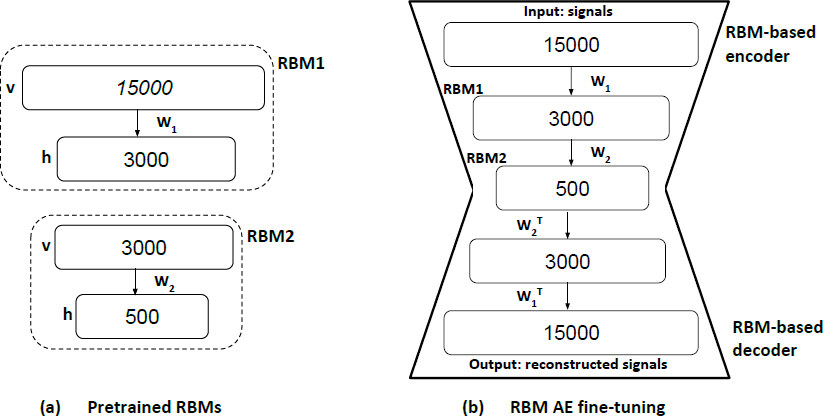
Figure 6. The used stacked RBM AE
Stacked AE training algorithm.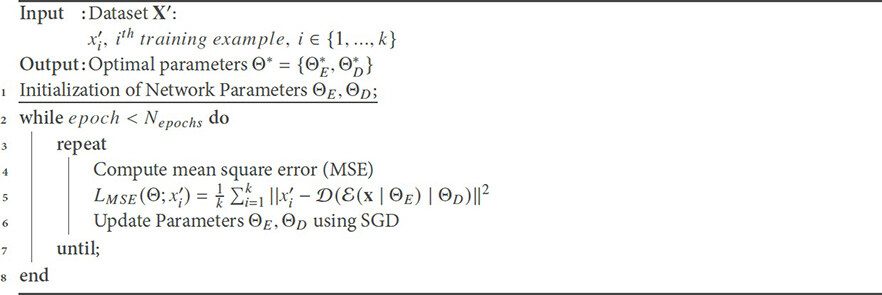
Once the AE is trained, we use the pre-trained AE as our feature extraction unit. The idea of using RBM AE is not to reduce the dimensionality of the raw data (power consumption signals), but it is rather to learn/extract a vector of features. These features represent the reconstruction of errors resultant from passing/feeding power traces to the trained RBM AE. At the end of Stage 1, we present a complete worked-out example to show the numbers: the size of the extracted features, and how exactly these features are computed.
Dimensionality Reduction (DR): Given that we are using a large window size and offset to augment the data, as a pre-processing step, we can generate a huge number of subsignals. To avoid the over-fitting problem when training the OC-SVM classifier, as well as extract the main components (which contain most of the discriminative information) from the AE’s output, we apply dimensionality reduction techniques, namely Principal Component Analysis (PCA) (explained above), to the AE’s reconstruction residual error vectors before training the classifier. The input is the resultant reconstruction error E, and the output is E′, which is a reduced version of E of a size m × K′, where K′ is the number of selected principle components, and K′  Win, as show in Figure 4 - step (4).
Putting FE steps together: To give an illustrative example of the Feature Extraction stage, assume that: (1) we obtain 15 signals from a device, i.e., m=15; and (2) each signal represents the power consumed by a device for 300 seconds, and that the power is sampled at 5000 samples/s. This gives us a power trace that has 1,500,000 samples, i.e., n = 1, 500, 000. Thus, our dataset X is a matrix of size (15 × 1, 500, 000). After applying the explained normalization, we use the formula given in the sliding window step. To compute K, assume further that we use Win = 15, 000 and an offset O = 2000. This gives us K = 742 subsignals for each original signal. In other words, each signal xi becomes 742 subsignals  . Thus, after the data augmentation step, the 15 power signals of our became 11,280 subsignals. To keep the notations consistent, the size of our dataset X′ becomes (11, 280 × 15, 000).
The next step is to use the trained RBM AE to extract the features. To generate the features, we pass these subsignals , each is a vector of size (1 × 15, 000), through the trained RBM AE. The trained RBM AE’s output should be a reconstructed version of the input . We then compute the loss/error for each subsignal using the mean squared error (mse). Thus, the generated features vector for each signal xi is 742 features. Each feature represents the computed reconstruction error of the subsignals of the original signal. Refereeing back to the notations used in Figure 4, the size of our dataset matrix (E) at this point is (15×742). The final step is to use the PCA to lower the dimensions of the dataset to the desired number of principal components (K′). We use the obtained dataset (E′) to train the classifier, as we explain in the following section.
Stage 2: Classification
The task of detection in our methodology is performed using a semi-supervised learning technique-Step (5) in Figure 4. In this step, we employ One-Class Support Vector Machines (explained above) as an anomaly detection technique. Since only data from one-class are available (power consumption signals obtained from normal behaving wireless devices), the objective of using OC-SVM is to learn a function that returns +1 for the normal behavior region (not anomalous) and −1 elsewhere, i.e., the malicious behavior region (anomalous). To obtain more versatile decision boundaries, we treat the kernel function as a hyper-parameter and investigate its impact on the detection performance. Referring back to Figure 4, we train the OC-SVM using the feature matrix E′ with m rows (number of observations) and K′ columns (number of features/ principal components), as illustrated in Figure 4 (Step (5)).
Procedure 2: Detection Procedure
The detection step in real-life scenarios utilizes the learned models from Procedure 1, namely the RBM AE and OC-SVM models. As shown in Figure 5, this procedure is designed to give an answer as to whether a device is behaving normally or not. Given an unknown power trace Ss from a device, the methodology starts by extracting the feature vector, which represents the reconstruction error Es′. This is the extracted reconstruction error after it is fed to PCA, i.e., after reducing its dimensions. Finally, Es’ is fed to the trained OC-SVM model; the classifier gives an answer about the health of the device.
Validation datasets
To validate our methodology, we used several datasets that cover a wide range of security threats. These datasets were collected in the lab, where two main classes of experiments were conducted. The first class concerns an experimental setup that uses a smartphone as the Device Under Test (DUT). In this class of experiments, the implemented scenarios cover a smartphone infected with emulated malware and real malware (taken from the well-known malware dataset-Drebin[30]). The second class of experiments is based on an IoT application, namely a smart parking application, where the DUT is an IoT device (IoT thing). This device is responsible for monitoring whether a parking spot is available or not. The IoT device is made of a control unit, which in this case is a Raspberry Pi, attached to an ultrasonic sensor. The IoT device is connected to a server through a wireless network (a WiFi gateway). In this class of experiments, the implemented scenarios a cover DDOS attack, where, in one case, the IoT device is the target of the attack (i.e., the victim), while, in the other case, it is the source of the attack (i.e., the attacker). It also covers malicious code that hijacks the IoT device resource to perform cryptomining. Table 1 summarizes these datasets with a detailed description of each security threat activity and its security implications.
Summary of the used security threats datasets
| Dataset Name (DUT) | Dataset and Threat Description |
|---|---|
| E-DC (SP) | Emulated malware: it is a piece of code that runs in the background of the device and executes certain activities. The assumptions made while designing these experiments are: (i) Real malware perform network activity to either (a) only download (DL) information to the compromised device (100% DL), (b) only upload (UL) user’s information to a remote server (100 % UL), or (c) upload and download information from/to the compromised device (ex. 50 % UL and 50 % DL). (ii) Real malware performs some local computations such as read/write to memory/storage. And (iii) real malware is not continuously active when they are installed; rather they work in bursts of activities. By having these aspects included in the development of the emulated malware, a wide range of real malware that are out there can be largely covered. In spite of the malware type (botnets, rootkits, and worms, refer to[50] for a detailed description of these malware), the activities it performs will fall largely in the range considered above. In these datasets, these scenarios can be classified into two main groups of malware, namely non-adaptive and adaptive malware. Non-adaptive refers to a malware that is active periodically (in a cyclic fashion). Several datasets are generated; each one of them represents a family of malware that depends on their network activity (ex., 50DL50UL malware family). Each family includes different malware instances depending on their “activity Duty Cycle” (DC). The DC represents the degree of activeness of the malware and is calculated as: DC=TONTON+TOFF × 100%, where TON refers to the time the malware is active performing some tasks and TOFF refers to the time when the malware is inactive. DC is the percentage of the time malware is active performing some tasks. Such classes of malware can compromise the confidentiality and integrity of users and their information. |
| E-1S E-RA (SP) | In contrast to the aforementioned malware, adaptive malware tries to eliminate the frequency component (cyclic) from its activities by randomized activation times and periods. In this scenario, there are two datasets: (1) E-1S refers to emulated malware that has a single activity period that gets activated at a random time and duration; and (2) E-RA which refers to emulated malware that gets activated at random times and durations (i.e., multiple activity periods). Such a class of malware is difficult to detect and can compromise the confidentiality and integrity of users and their information. |
| Real (SP) | In this set of experiments, we use 5 real applications (namely, Buscaminas, Tetris, Tilt, Wordsearch, and Yams) that are classified/known as malware from the well-known malware dataset discussed in[30]. We downloaded their real-non-malicious versions from the Google Play store and conducted the experiments. These malware intend to steal users’ data and hence can compromise their Confidentiality. |
| DDOS (IoT) | Distributed Denial of Service (DDOS) attack: In a nutshell, DDOS involves a node (ex., IoT device) or a large number of them sending large traffic volumes to overwhelm the Internet infrastructure or servers in a harmful way (i.e., to restrict the availability of services). In our experiment, we consider two cases: (i) IoT device as a source/contributor of the attack – DDOS-A; (ii) IoT device as a victim of the attack - DDOS-V. In the first scenario, the assumption is that an attacker/hacker takes control over the device and injects a code that instructs the device to generate requests/traffic to flood the network. In the second scenario, we consider the IoT device as a server that provides information to a system. So when the IoT device is attacked, it becomes unreachable and hence the system losses it. We use Low Orbit Ion Cannon (LOIC) as a tool for simulating the DDOS attack[51]. |
| Cry-M (IoT) | Cryptocurrency Mining Malware: This is a malicious piece of code (also known as cryptojacking) that tries to hijack the device’s resources so that it can perform cryptocurrency mining (such as Bitcoin) for the benefits of the hacker who installed it. Such a security threat can compromise the availability of the users’ resources. In this kind of security breach, we assume that the attacker has made it past all of the security measures in place and was able to install the malware (Miner). The Internet of Things is a very suitable target for this type of malware, due to the increasing number of devices connected to the Internet, as well as the increasing computational power of IoT devices. While each IoT device has nowhere near enough computational power to obtain measurable profit from cryptocurrency mining by itself, cryptojacking malware can easily spread across the Internet and infect very large numbers of IoT devices. Many cryptojacking programs have targeted IoT devices, specifically targeted Raspberry Pi based IoT devices[50,52]. The program simulates cryptocurrency mining by computing the SHA-256 hashes of random byte sequences in order to find sequences whose hashes start with multiple zero bytes. Except for the difficulty of the problem, this is exactly the same protocol that Bitcoin uses for its proof-of-work, and is exactly how Bitcoin mining programs work. The program/miner is only active for part of the time, which is a strategy used by malware to avoid detection. |
To this end, the normal operation of the DUT in the both cases, the smartphone and IoT device, is as follows: (1) In all of the smartphone-based experiments that employ the emulated malware explained in Table 1, the collected datasets comprise two main classes: Normal class and Malicious class. In the Normal operation class, we collected the power consumed by the smartphone while running YouTube, and no other applications were running in the background. In the Malicious behavior class, the power measurements were obtained from the smartphone running YouTube and an emulated malware (datasets E-DC, E-RA, or E-1S, as explained in Table 1) running in the background; and (2) In all of the IoT-based experiments that employ all of the security threats explained in Table 1, the Normal operation class represented the operation of the IoT device performing the tasks needed for the smart parking application.
The Normal operation in both cases (smartphone or IoT device) should not deviate much when it is performing its regular tasks. Therefore, its normal behavior is expected to be reflected closely in the power consumed by the device. In both classes explained above, the DUT was supplied with power using the Monsoon Power Monitor. The Monsoon Power Monitor is a reliable device which measures different electrical parameters, namely voltage and current, in real time for a device while providing constant direct current voltage to it. The measurements were taken at a sampling rate (Fs) of 5000 samples/s; thus, we can assert that it has high sensitivity to detect any short activity running on the DUT. We repeated each class’s experiment a number of times, with each observation (power measurement) lasting for 300s (5min). Given the sampling frequency of our power monitor was Fs = 5000 samples/s and the duration of the observation was T = 300 s, each observation contained 1, 500, 000 samples that characterize a smartphone in either of the above-mentioned classes. Furthermore, the laptop was connected to the monitoring device and was used to store the measurements that were collected to build up the datasets.
Experiments and results
Experiments
The problem of detecting malicious behavior in wireless devices is a semi-supervised classification problem. Consequently, given the datasets that we have, we perform binary classification to validate our method. The healthy behavior – Normal class - is tested against its anomalous behavior version – Malware class. Based on the this formulation, we have conducted several experiments to train and test our methodology. The analysis covered three main components, namely: (1) visualization of the extracted features; (2) justification for the use of OC-SVM; and (3) detection performance of the methodology and a comparison. The training and testing experiments were performed on a powerful analysis platform (Colab)[53]. The deep learning tasks were carried out in Python using Google Tensorflow framework and Keras[54] Python libraries. The PCA and OC-SVM were performed using the well-know scikit-learn Python library[43].
Features’ visualization and results
The dataset used to generate the following visualizations is E-DC. We choose the malware family 50UL50DL, which represents malware that utilize % of its active period to upload information to the cloud and the remaining 50% to download from a remote server. In this family of malware we have 6 different malware instances each with specific “activity Duty Cycle” (DC), as explained in Table 1. The duty cycles (DC) of the malware in this family are DC = i%, i ∈ {1, 2, 3, 4, 8, 12}. Since we use PCA as a dimensionality reduction technique, the first step we took to investigate how effective the RBM-AE’s features are is to visualize the percentage of variance of Normal class of this dataset (50UL50DL). Figure 7 (a) shows the percentage of the variance that the first 12 principal components contain. It also show the cumulative PCs variance, which shows that most of the variance (almost 100 %) is contained in these 12 components. Then in Figure 7 (b) we show how the data points from normal class and the six malware instances (from 50UL50DL malware family) are distributed using PCA’s first two components. PC1 and PC2 are the first two components obtained from PCA, and they represent the highest variance in the data points used in training. PC1 is the projection of the features vector in the direction of the highest variance, and PC2 is the projection of the features vector in the direction of the second-highest variance. As can be noticed in Figure 7 (b), although dimensionality reduction loses some information and visualization results of low-dimensional space cannot fully reveal what are in the high-dimensional space, it is still insightful that the extracted features carry good information that can be used to construct an effective detection model. In the next part of the results, we show the impact of the number of the chosen principle components on the methodology overall detection performance.
Figure 7. RBM-AE’s features visualization.
Classifier performance analysis
After visualizing the output of our methodology’s feature extraction stage, next we evaluate the performance of the chosen classifier - OCSVM. To training OC-SVM, there are some model specific hyper-parameters that needs to be tuned in order to achieve the best detection performance. We use cross-validation and grid search to optimise the performance of the classifier. We start by randomly splitting the dataset, the Normal class data, into training and testing datasets. Then, we use the training portion to perform five-fold cross-validation. In this step we basically split the training dataset into five portions and use four of them to training the OC-SVM and evaluate the learned model on the fifth fold. We repeat this step 5 times and finally using the grid-search we pick the parameters that gives us the best detection performance.
Before we report the results, we explain the metrics used to evaluate the performance of our methodology. Our problem is an anomaly detection problem, which means, in practice, we have many data from the Normal class and a few observations from the anomalous class, Malware in this case. Thus, in addition to reporting the accuracy (Acc), recall (R), and precision (P) in some of the results, we chose to use the F1-score (F1) as a single and main metric to evaluate the detection performance of our methodology since it combines both recall and precision, as shown in Table 2. We find that reporting the precision and recall individually is very important as well since they put more weight to a false positive and false negative, respectively.
Performance evaluation metrics
 |  |  |  |
True Positive (TP) refers to malicious behavior correctly identified as malware, False Positive (FP) means a benign/normal behavior is incorrectly identified as malware, True Negative (TN) is benign/normal behavior correctly identified as benign, and False Negative (FN) refers to malicious behavior incorrectly identified as benign.
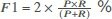
Figure 8 illustrates the decision boundary found by the kernelized OC-SVM. The used kernel function is Radial Basis Function (RBF), which is a kind of Gaussian kernels. The decision boundary shows that the model can separate most of the positive points (Normal class observations) from the negative ones correctly. It also shows that the learned model is able to correctly classify the unseen observations from the Normal class (green circles with black edges in the figure). Figure 9 (a) highlights the impact of the OC-SVM kernel functions on the accuracy of the model for different evaluation metrics. It can be noted that the RBF gives the best detection performance over the linear and Sigmoid kernels. It was thus used in all of the following experiments.
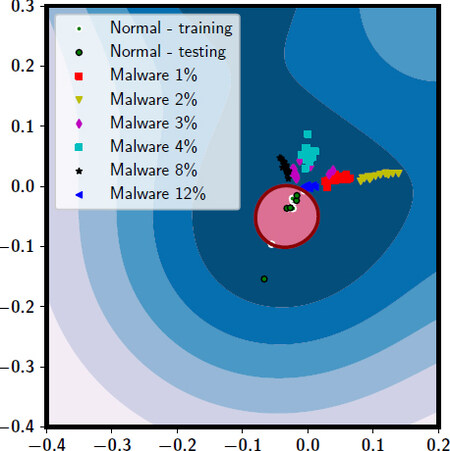
Figure 8. OC-SVM decision boundary and malware classes distribution
Figure 9. RBM-AE’s features visualization.
Furthermore, the impact of PCA on the classification performance was verified. The way we investigates that was to vary the number of principal components (PC) used to train our OC-SVM and observe the detection performance accordingly, as shown in Figure 9 (b). The results show that the first two PCs produce the best detection performance. This confirms the observation shown in Figure 7 (a) that the first two PCs contain much of the variance [Figure 7 (a)] and the fact that visualizing the first two PCs showed good separation of the malware instances of the 50UL50DL malware family. Moreover, in Figure 9 (b), it can be noted that the higher the number of PCs is, the lower the detection performance we get. The worst detection performance was experienced when the number of principal components (PCs) was 5; this could be attributed to the problem of overfitting. However, we notice that, when the number of PCs passes five, the model surprisingly performs well again. Having more features (higher number of PCs) in this case should consistently get the trained model to fall into the overfitting problem. Thus, the detection performance is expected to worsen as the number of PCs is increased.
Comparison results
To demonstrate the effectiveness of our AE based features extraction technique, we compared the average accuracy and F1-score of our methodology against a baseline model, as well as against previously reported techniques[9,19,27]. A brief description of the used baseline model is as follows: We extracted two features (namely, the mean and standard deviation) out of each power trace. Then, we trained the traditional Support Vector Machine (SVM[55]) on the extracted features.
Since the objective in[9,19,27] is similar to the objective of our paper (malware detection in wireless devices), and the nature of the raw data is the same as the data considered in this study (i.e., the power consumed by devices treated as signals), this technique was chosen to be the best fit to have a fair comparison with. In the literature, there are a couple of studies that share the same objective; we felt that the comparison would not be fair since the type of the raw data (EM emissions[10,11,25]) is completely different.
Table 3 shows that AE based features outperform two of the techniques, the baseline and the one in[19], with at least 30% performance gain. To compare with the model in[19], we have implemented their approach and run it on our dataset. The obtained accuracy of our approach reached 97%, while the accuracy of the models in[9,27] were 88% and 90%, respectively. We argue that such a good detection performance is due to: (1) the ability of the stacked RBM AE to learn good features that capture the complexity of the normal behavior of the device under study; and (2) the high sampling rate that is used in our monitoring methodology. Such a rate makes it possible to capture information about the short-lived events executed onboard a device. Since the model in[19] depends on data sampled at a rate of 5 samples/s, the approach fails to perform well, as the results in Table 3 show. Although the models in[9,27] were based on supervised learning and used the same dataset as ours (dataset E-DC in Table 1), which is sampled at the same sampling rate as the one used in this study, the performance of our methodology shows at least 7% detection improvement over the models in[9,27]. The main reason goes back to Point (1), i.e., the good features extracted by the stacked RBMs. It is important to note that the performance of our methodology is not very far from the performance reported in[27]; however, our methodology has two main advantages over[27]: (1) it requires fewer computation resources, which makes it more suitable for real-time detection and resource constrained applications; and (2) it is a semi-supervised technique, which makes it more practical. A final remark on the impact of sampling rate: our comparison with the model in[19] showed that the higher is the sampling rate, the better is the detection performance. This is aligned with the findings reported in[9], where the authors showed that the detection performance can worsen as the sampling rate is lowered.
Comparison results
Figure 10 shows a comparison we performed to ensure that the chosen classifier is a good pick. In Figure 10, we compare OC-SVM with two other unsupervised methods namely, Robust covariance (RC)[56] and Isolation Forest (IF)[57]. In this comparison we show how the three methods compare in terms of the F1-score performance as well as the time to recall the model. It can be noticed that Robust covariance and Isolation Forest performance is always 0.8 irrespective of the malware activeness degree (DC %). The reason is that the normal behavior is used in training all of the classifiers, so the decision’s boundary of the modeled data (normal behavior) does not change as the malware DC % changes.
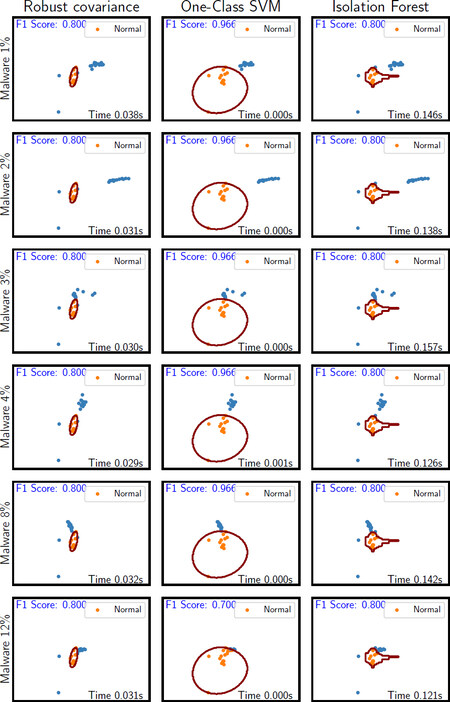
Figure 10. Classifier performance comparison
The distribution of the malware points falls outside of the normal region across the version of malware scenarios. It is also worth mentioning the sudden drop of OC-SVM in the case of malware with DC = 12%; some points, for an unrecognized reason, seemed similar to the normal behavior and fell in the normal region, i.e., were classified wrongly as not malicious. Clearly, in Figure 10, OC-SVM is the fastest in terms of predicting new observations and also out performs the RC and IF classifiers with significant gain throughout the 6 malware instances (DC = i%, i ∈ {1, 2, 3, 4, 8, 12}). Whether the malware is with DC = 1% - the least active case, or the malware with DC = 12% - the most active case; the model shows good detection performance regardless how active the malware is, where the obtained F1-score reaches 96.6%, thanks to the good features learned by the RBM AE.
Detection coverage results
In this section, we show the performance of the proposed methodology in detecting different security threats that target wireless/IoT devices. In the applications of anomaly detection, including detection of security threats, we are more interested in finding out when a security threat is present but is not detected, the so-called false negative (FN). Therefore, when analyzing the performance of our methodology, we not only report the accuracy, but also show the F1-score, recall, and precision, as they are more indicative in our case. Table 4 shows a summary of the performance of our methodology on the seven datasets that we used. The most challenging detection task was encountered on the E-1S dataset. The obtained F1-score is not as high as on the other datasets; however, having a high recall for this particular case indicates a low FN. This means, in most cases, our methodology was able to correctly label and detect the presence of malware, even though, in the case of E-1S, the malware is only active at random intervals. The performance on the E-RA dataset is also considerably lower than the other datasets, which is something we expected given the fact that its activation times and periods are randomized. Both E-1S and E-RA are adaptive malwares, which means that they tend to hide their operation and activity so that they go undetected.
Summary of the results across all of the datasets - (* averaged results)
| Metric\Threat | E-DC* | E-1S | E-RA | Real* | DDOSA | DDOS-V | Cry-M |
|---|---|---|---|---|---|---|---|
| F1-score | 0.91 | 0.7 | 0.80 | 0.87 | 0.985 | 0.98 | 0.90 |
| Accuracy | 0.89 | 0.6 | 0.83 | 0.81 | 0.98 | 0.98 | 0.86 |
| Recall | 0.933 | 0.93 | 1.00 | 0.93 | 0.97 | 0.97 | 0.97 |
| Precision | 0.90 | 0.56 | 0.67 | 0.83 | 1.00 | 1.00 | 0.85 |
In the real malware dataset, Real, the results reported in Table 4 were averaged over the five malicious apps in the dataset. Overall, the results are in the range of 85%. Figure 11 demonstrates the detection performance in terms of the four selected measures (F1-score, accuracy, recall, and precision). These results justify that the used emulated datasets cover a wide range of malicious behaviors/attacks, hence their value in evaluating new detection techniques.
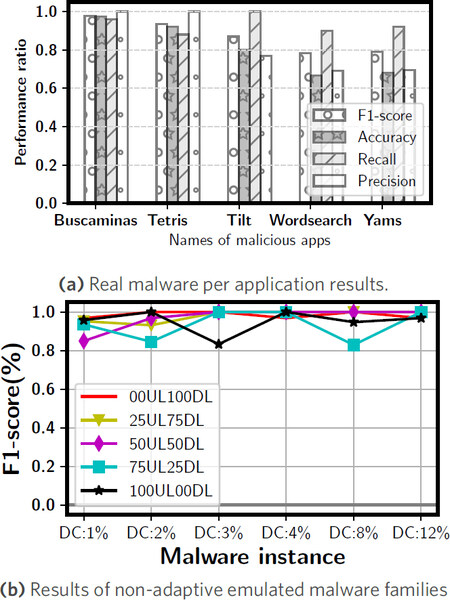
Figure 11. F-score results.
In all of the IoT device datasets, namely distributed of service attacks (DDOS-V and DDOS-A) and the cryptomining (Cry-M) datasets, the detection accuracy and F1-score reach 90% in most of the cases. Thus, whether a device is under attack or it is hacked to serve as the source of the attack, the device’s owner can be notified and alarmed of such a cyber-threat.
One might argue that DDoS and cryptocurrency mining malwares are high-power malicious attacks by nature, thus are easy cases to detect using the proposed approach. This argument makes the need to implement emulated malware, where we can control the amount of time a malware can be active, even more compelling. As we explain in the Validation Datasets Section, various malicious behaviors/activities (e.g., a malware that is active for one short time only, as in dataset E-1S; a malware with 1% DC activity, as in dataset E-DC, or a malware with random activation periods, as in dataset E-RA) were generated to represent malwares that do not consume/use a lot of power. The detection performance, as shown in Table 4, of the proposed approach on these scenarios confirms that our approach is not only effective on security threats that are caused by attacks/malwares that consume a lot of power, but is also effective on the attacks/malwares that are rarely active and consume a small amount of power.
To further elaborate on the effectiveness and the practicality of the proposed approach, a common question in the security field is: Can the detection be evaded if attackers find out about the proposed detection approach? Generally, this is a difficult task since there is an inherent connection between the tasks a device performs and the power it consumes. In the side-channel attacks, the whole idea of revealing secret keys depends on the aforementioned fact. However, one way that an attacker might seek to evade detection is through the attempt to hide some of their malware’s activities behind legitimate power consumption bursts/spikes. In our validation datasets scenarios, specifically in the emulated malware families, we simulated such a strategy by having a high-power activity application (YouTube) running as the normal/legitimate behavior, while the emulated malware runs in the background. In most of the scenarios (E-DC, E-RA, and E1S) shown in Figure 11 (b) and Table 4, our methodology performs well (91%, 80%, and 70% F1-scores, respectively). The 1Sipke (E- 1S) emulated malware case shows a relatively low precision, where we have high false positives (i.e., normal behavior identified as malicious).
Finally, Figure 11 (b) depicts the performance of our methodology on our non-adaptive families of malware (E-DC dataset). This figure can be interpreted as follows: each malware family, e.g., 00UL100DL family, has six malwares, namely malware with i% DC (duty cycle), where i ∈ 1, 2, 3, 4, 8, 12. The 1% DC Malware is malware that is only active 1% of the cycle period. Thus, if the cycle period is 60 s, then this malware is only active for 1 s and goes to sleep for the remaining 59 s. The obtained F1-score for this malware family is very high throughout all the malware families and ranges between 83% and 100%. Whether the malware is only active for a short period of time, the case of 1% DC malware, or the most active malware, 12% DC malware, where the malware stays active for case 7.2 s, the methodology can detect all of them. A similar trend is noticed for the other malware families, as the results in Figure 11 (b) illustrate. The results of detection coverage across the wide range of validation datasets were very good, and, hence, confirm the usefulness and applicability of the proposed approach.
Conclusions
In this paper, we introduce a new malware detection technique that is based on non-intrusive monitoring of device’s power consumption. The measured power readings of a device are treated as signals carrying discriminative information that can be learned. The idea is to learn robust features out of the power signals using stacked RBM AEs and OC-SVM. We validated our approach using real malware taken from the Derbin dataset as well as from a wide spectrum of emulated malware. The obtained results from real as well as emulated malware confirm the effectiveness of the proposed technique. The performance of the proposed methodology was compared to previously reported approaches. Finally, the methodology was also applied to well-known attacks (namely, DDOS attack and Cryptomining malware) on the IoT application datasets, where the obtained results show a robust detection performance.
Although this study covered the effectiveness of using stacked RBM to extract useful information from the power consumption of a device, there are a couple of limitations to be considered in the future. In the practical deployment of such a detection approach, the time required to detect a security threat needs to be investigated. For instance, if a DDOS attack is initiated, how long will it take before it can be flagged should be studied.
Declarations
AcknowledgmentsThe authors would like to thank Alexander Kitaev, Parth Priteshkumar Shah, and Ricardo Alejandro Manzano for their help in implementing some of the experiments and the data collection part.
Authors’ contributionsMade substantial contributions to conception and design of the study, implementation of the code and performed data analysis, literature review, and to the writing of the manuscript: Albasir A;
Contributed to the initial prototype of the data analysis phase: Hu Q;
Provided technical, administrative, and advise on investigation, methodology and supervision: Naik K and Naik N
Availability of data and materialsThe data will be made publicly accessible in the near future.
Financial support and sponsorshipAbdurhman gratefully acknowledges the support in part by the Natural Sciences and Engineering Research Council (NSERC), Canada through Canada Graduate Scholarships—Doctoral (CGS D), and the Ministry of Higher Education and Scientific Research - Libya for full financial support.
Conflicts of interestAll authors declared that there are no conflicts of interest.
Ethical approval and consent to participateNot applicable.
Consent for publicationNot applicable.
Copyright© The Author(s) 2021.
REFERENCES
1. Evans D. The internet of things: How the next evolution of the internet is changing everything. Available from: https://www.cisco.com/c/dam/en_us/about/ac79/docs/innov/IoT_IBSG_0411FINAL.pdf [Last accessed on 29 Sep 2020].
2. Manyika J. The Internet of Things: Mapping the value beyond the hype. Available from: https://www.mckinsey.com/~/media/McKinsey/Industries/Technology%20Media%20and%20Telecommunications/High%20Tech/Our%20Insights/The%20Internet%20of%20Things%20The%20value%20of%20digitizing%20the%20physical%20world/TheInternetofthingsMappingthevaluebeyondthehype.pdf [Last accessed on 29 Sep 2020].
3. Alaybeyi SB, Perkins E, Contu R. Market Guide for IoT Security. Available from: https://www.gartner.com/en/documents/3465419/marKet-guide-for-iot-security [Last accessed on 29 Sep 2020].
4. Kaspersky. Financial Cyberthreats in 2018. Available from: https://securelist.com/financial-cyberthreats-in-2018/89788/ [Last accessed on 201903].
5. Avast TIT. Android apps on Google Play Store come with nasty surprise. Available from: https://blog.avast.com/adware-plagues-google-Play [Last accessed on 1 Jun 2019].
6. Hilton S. Dyn analysis summary of friday october 21 attack. Available from: https://dyn.com/blog/dyn-analysis-summary-of-friday-oc-tober-21-attack [Last accessed on 29 Sep 2020].
7. Tsiropoulou EE, Baras JS, Papavassiliou S, Qu G. On the mitigation of interference imposed by intruders in passive RFID networks. In: International Conference on Decision and Game Theory for Security New York, United States. Springer; 2016. pp. 62-80.
8. Vamvakas P, Tsiropoulou EE, Papavassiliou S. Exploiting prospect theory and risk-awareness to protect UAV-assisted network operation. EURASIP J Wireless Com Network 2019:286.
9. Albasir A, James RSR, Naik K, Nayak A. Using Deep Learning to Classify Power Consumption Signals of Wireless Devices: An Application to Cybersecurity. In: 2018 IEEE Int. Conference on Acoustics, Speech and Signal Processing (ICASSP) Calgary, Canada. IEEE; 2018. pp. 2032-6.
10. Khan H, Sehatbakhsh N, Nguyen L, et al. IDEA: Intrusion Detection through Electromagnetic-Signal Analysis for Critical Embedded and Cyber-Physical Systems. IEEE Trans Dependable Secure Comput 2019:1-1.
11. Khan H, Sehatbakhsh N, Nguyen L, Prvulovic M, Zajić A. Malware Detection in Embedded Systems Using Neural Network Model for Electromagnetic Side-Channel Signals. J Hardw Syst Secur 2019 2019:1-14.
12. Hoffmann J, Neumann S, Holz T. Mobile malware detection based on energy fingerprints—a dead end? In: International Workshop on Recent Advances in Intrusion Detection. EuroGP 2002: Proceedings of the 5th European Conference on Genetic Programming Rodney Bay, St. Lucia. Springer; 2013.
13. Bridges R, Hernández Jiménez J, Nichols J, Goseva-Popstojanova K, Prowell S. Towards Malware Detection via CPU Power Consumption: Data Collection Design and Analytics. 2018 17th IEEE International Conference On Trust, Security And Privacy In Computing And Communications/ 12th IEEE International Conference On Big Data Science And Engineering (TrustCom/BigDataSE) New York, United States. IEEE; 2018. pp. 1680-4.
14. Azmoodeh A, Dehghantanha A, Conti M, Choo KKR. Detecting crypto-ransomware in IoT networks based on energy consumption footprint. J Ambient Intell Human Comput 2017;9:1141-52.
15. Sanjab A, Saad W, Başar T. Prospect theory for enhanced cyber-physical security of drone delivery systems: A network interdiction game. In: 2017 IEEE International Conference on Communications (ICC) Paris, France. Berlin: IEEE; 2017. pp. 1-6.
16. Cvitić I, Vujić M, Husnjak S. Classification of Security Risks in the IoT Environment. in 26th DAAAM International Symposium on Intelligent Manufacturing and Automation Vienna, Austria. DAAAM International Vienna; 2015. pp. 0731-40.
17. Zubrow D. IEEE Standard Classification for Software Anomalies. IEEE Computer Society 2010:1-23.
18. Chandola V, Banerjee A, Kumar V. Anomaly detection: A survey. ACM computing surveys (CSUR) 2009;41.
19. Zefferer T, Teufl P, Derler D, et al. Towards Secure Mobile Computing: Employing Power-Consumption Information to Detect Malware on Mobile Devices. Int journal on advances in software 2014;7.
20. Yang H, Tang R. Power consumption based android malware detection. J of Electrical and Computer Eng 2016. [DOI: https://doi.org/10.1155/2016/6860217]
21. Ayşan Aİ, Şen S. Api call and permission based mobile malware detection. 2015 23nd Signal Processing and Communications Applications Conference (SIU) Malatya, Turkey. IEEE; 2015. pp. 2400-3.
22. Jacoby GA, Marchany R, Davis N. Battery-based intrusion detection a first line of defense. Information Assurance Workshop, 2004. Proceedings from the Fifth Annual IEEE SMC New York, United States. IEEE; 2004. pp. 272-9.
23. Antunes J, Neves N. Using Behavioral Profiles to Detect Software Flaws in Network Servers. 2011 IEEE 22nd International Symposium on Software Reliability Engineering Hiroshima, Japan; 2011. pp. 1-10.
24. Tobiyama S, Yamaguchi Y, Shimada H, Ikuse T, Yagi T. Malware Detection with Deep Neural Network Using Process Behavior. In: 2016 IEEE 40th Annual Computer Software and Applications Conference (COMPSAC) Atlanta, United States. IEEE; 2016. pp. 577-82.
25. Nazari A, Sehatbakhsh N, Alam M, Zajic A, Prvulovic M. Eddie: Embased detection of deviations in program execution. In: 2017 ACM/IEEE 44th Annual International Symposium on Computer Architecture (ISCA) Toronto, Canada. IEEE; 2017. pp. 333-46.
26. Hoh B, Gruteser M, Xiong H, Alrabady A. Enhancing security and privacy in trafficmonitoring systems. IEEE Pervasive Computing 2006;5:38-46.
27. James R, Albasir A, Naik K, et al. A Power Signal Based Dynamic Approach to Detecting Anomalous Behavior in Wireless Devices. In: Proceedings of the 16th ACM Int. Symposium on Mobility Management and Wireless Access MobiWac’18 Montreal, Canada. ACM; 2018.
28. James R, Albasir A, Naik K, Dabbagh MY, Dash P, Zaman M. Detection of anomalous behavior of smartphones using signal processing and machine learning techniques. In: 2017 IEEE 28th Annual Int. Symposium on Personal, Indoor, and Mobile Radio Communications (PIMRC) Windsor,Canada. IEEE; 2017.
29. Kim H, Smith J, Shin K. Detecting energy-greedy anomalies and mobile malware variants. In: Proceedings of the 6th international conference on Mobile systems, applications, and services Breckenridge, United States. ACM; 2008. pp. 239-52.
30. Arp D, Spreitzenbarth M, Hubner M, Gascon H, Rieck K, Siemens C. DREBIN: Effective and Explainable Detection of Android Malware in Your Pocket. In: Ndss; 2014; doi: 10.14722/ndss.2014.23247.
31. t Stroud F. Cryptomining Malware. Available from: https://www.webopedia.com/TERM/C/cryptomining-malware.html [Last accessed on 30 Oct 2019].
32. Zhang L, Tiwana B, Dick R, et al. Accurate online power estimation and automatic battery behavior based power model generation for smartphones. In: Hardware/Software Codesign and System Synthesis (CODES+ ISSS), 2010 IEEE/ACM/IFIP International Conference on Scottsdale, United States. IEEE; 2010.
33. Hinton GE, Salakhutdinov RR. Reducing the dimensionality of data with neural networks. science 2006;313:504-7.
34. Tagawa T, Tadokoro Y, Yairi T. Structured denoising autoencoder for fault detection and analysis. In: Proceedings of the Sixth Asian Conference on Machine Learning, Asian Conference on Machine Learning 2014. pp. 96-111.
35. Marchi E, Vesperini F, Weninger F, Eyben F, Squartini S, Schuller B. Non-linear prediction with LSTM recurrent neural networks for acoustic novelty detection. In: 2015 International Joint Conference on Neural Networks (IJCNN). IEEE 2015. pp. 1-7.
36. Kawaguchi Y, Endo T. How can we detect anomalies from subsampled audio signals? In: 2017 IEEE 27th International Workshop on Machine Learning for Signal Processing (MLSP). IEEE 2017. pp. 1-6.
37. Hinton GE. A practical guide to training restricted Boltzmann machines. Springer; 2012. pp. 599-619.
38. Hinton GE. Deep belief networks. Scholarpedia 2009;4:5947. Revision #91189. [DOI: 10.4249/scholarpedia.5947]
39. Geman S, Geman D. Stochastic Relaxation, Gibbs Distributions, and the Bayesian Restoration of Images. IEEE Trans Pattern Anal Mach Intell 1984;PAMI6:721-41.
40. Daoud M, Mayo M. Using Swarm Optimization To Enhance Autoencoders Images. arXiv 1807.03346 [Preprint]. 2018. Available from: https://dblp.org/rec/bib/journals/corr/abs-1807-03346..
41. Smith LI. A tutorial on principal components analysis. Available from: http://www.cs.otago.ac.nz/cosc453/student_tutorials/principal_components.pdf [Last accessed on 13 Oct 2020].
42. Dawson RMA, Shen Z, Furst DA, et al. Design of an Improved Pixel for a Polysilicon ActiveMatrix Organic LED Display. Available from: https://scholar.princeton.edu/sites/default/files/sturm/files/1998_dawson.soc_inf_disp_symp.design.w_cover.pdf [Last accessed on 13 Oct 2020].
43. Pedregosa F, et al. Scikitlearn: Machine Learning in Python. Available from: https://www.researchgate.net/publication/51969319_Scikit-learn_Machine_Learning_in_Python [Last accessed on 13 Oct 2020].
44. Minka TP. Automatic choice of dimensionality for PCA. In: Proceedings of the 13th International Conference on Neural Information Processing Systems MIT Press; 2000. pp. 577-583.
45. Schölkopf B, Williamson RC, Smola AJ, Shawe-Taylor J, Platt JC. Support vector method for novelty detection. MIT Press; 2000. p. 5828.
46. Mohamed Ar, Dahl GE, Hinton G. Acoustic modeling using deep belief networks. IEEE transactions on audio, speech, and language processing 2011;20:14-22.
47. Creusot C, Munawar A. Real-time small obstacle detection on highways using compressive RBM road reconstruction. In: 2015 IEEE Intelligent Vehicles Symposium (IV). IEEE 2015. pp. 162-7.
48. El-Alami FZ, El Mahdaouy A, El Alaoui SO, En-Nahnahi N. A Deep Autoencoder-Based Representation For Arabic Text Categorization. Journal of Information and Communication Technology 2020;19:381-98.
49. Shao H, Jiang H, Zhao H, Wang F. A novel deep autoencoder feature learning method for rotating machinery fault diagnosis. Mechanical Systems and Signal Processing 2017;95:187-204.
50. La Polla M, Martinelli F, Sgandurra D. A survey on security for mobile devices. IEEE communications surveys & tutorials 2012;15:446-71.
51. Project P. Low Orbit Ion Cannon - An open source network stress tool. Available from: https://github.com/NewEraCracker/LOIC [Last accessed on 2019-8-30].
52. Martin ED, Kargaard J, Sutherland I. Raspberry Pi Malware: An Analysis of Cyberattacks Towards IoT Devices. In: 2019 10th International Conference on Dependable Systems, Services and Technologies (DESSERT) Leeds, United Kingdom. IEEE; 2019. pp. 161-6.
53. Carneiro T, Medeiros Da Nóbrega RV, Nepomuceno T, Bian G, De Albuquerque VHC, Filho PPR. Performance Analysis of Google Colaboratory as a Tool for Accelerating Deep Learning Applications. IEEE Access 2018;6:61677-85.
54. Chollet F, et al. Keras. Available from: https://www.fda.gov/NewsEvents/Newsroom/PressAnnouncements/ucm574058.htm [Last accessed on 2017-9-29].
55. Smola AJ, Schölkopf B. A Tutorial on Support Vector Regression. 2003.
56. Peña D, Prieto FJ. Multivariate outlier detection and robust covariance matrix estimation. Technometrics 2001;43:286-310.
57. Liu FT, Ting KM, Zhou ZH. Isolation forest. In: 2008 Eighth IEEE International Conference on Data Mining Pisa, Italy. IEEE; 2008. pp. 413-22.
Cite This Article
Export citation file: BibTeX | RIS
OAE Style
Albasir A, Hu Q, Naik K, Naik N. Unsupervised detection of security threats in cyberphysical system and IoT devices based on power fingerprints and RBM autoencoders. J Surveill Secur Saf 2021;2:1-25. http://dx.doi.org/10.20517/jsss.2020.19
AMA Style
Albasir A, Hu Q, Naik K, Naik N. Unsupervised detection of security threats in cyberphysical system and IoT devices based on power fingerprints and RBM autoencoders. Journal of Surveillance, Security and Safety. 2021; 2(1): 1-25. http://dx.doi.org/10.20517/jsss.2020.19
Chicago/Turabian Style
Albasir, Abdurhman, Qicheng Hu, Kshirasagar Naik, Nitin Naik. 2021. "Unsupervised detection of security threats in cyberphysical system and IoT devices based on power fingerprints and RBM autoencoders" Journal of Surveillance, Security and Safety. 2, no.1: 1-25. http://dx.doi.org/10.20517/jsss.2020.19
ACS Style
Albasir, A.; Hu Q.; Naik K.; Naik N. Unsupervised detection of security threats in cyberphysical system and IoT devices based on power fingerprints and RBM autoencoders. J. Surveill. Secur. Saf. 2021, 2, 1-25. http://dx.doi.org/10.20517/jsss.2020.19
About This Article
Copyright

Data & Comments
Data


 Cite This Article 9 clicks

 Like This Article 16
likes
Like This Article 16
likes


Comments
Comments must be written in English. Spam, offensive content, impersonation, and private information will not be permitted. If any comment is reported and identified as inappropriate content by OAE staff, the comment will be removed without notice. If you have any queries or need any help, please contact us at support@oaepublish.com.